|
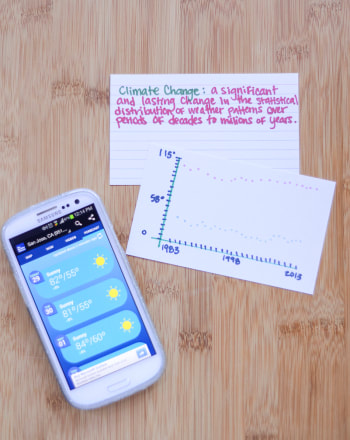
Just because Earth Day has passed, that doesn't mean you can't continue to learn about the changing planet! Here is a climate change experiment you can do at home with limited materials. What Is Climate Change? Standard deviation is a statistic that tells you how closely a group of numbers (for example, temperatures) are clustered around a mean value (average temperature). When the standard deviation is small, the numbers are fall close to the mean. When the standard deviation is large, the individual values are spread out far from the mean. In this environmental science activity, students explore both science and statistics as they track changes in temperatures over time. Check out more STEM activities for your students at Education.com. What You Need: - Calculator(Microsoft Excel may alternately be used if it is available to the student.) What You Do: 1) Based on your personal observations of the weather patterns, formulate a hypothesis that predicts whether local weather conditions are outside historical norms. 2) Decide on a location whose weather patterns you wish to monitor. 3) Check the United States Historical Climatology Network web site to see whether it includes historical weather data for the location you have chosen to study. If it doesn’t, select a nearby location. The website has temperature precipitation data going back over 100 years for many locations in the U.S. 4) Calculate the average temperature and precipitation values for each month going back at least 30 years. 5) Tabulate and plot your results. 6) Compare temperature and precipitation data for the current month with the historical values. 7) Determine whether the average measured temperature falls within one, two or three standard deviations of the mean. 8) Evaluate your hypothesis. If necessary, revise it and perform additional calculations. Provided by Education.com
1 Comment
|

